- Open Takara Cut-Site Navigator using your web browser.
- If desired, enter the name of the sample sequence into the "Sample Name" box.

The name entered into the box will be used as the file name when the analysis results are exported. - Enter the sequence data on which you would like to carry out a restriction enzyme search into the "Sequence" box.
You may choose to either copy and paste DNA sequence, or upload a file.
Select "Circle" if the sequence data corresponds to a plasmid or other circular sequence or "Linear" if it corresponds to a linear fragment.
Ambiguous codes are available here.
* "Cut & Paste DNA Sequence": When entering sequence information directly,
Copy and paste the sequence information into the "Sequence" entry box.
Concerning the file format, you can use the basical text form, fasta form and Genbank form.
* "Enter your Local File": When uploading a sequence file, click the button on the right side to display the file selection window.
Select the sequence information file from the local hard drive.

- Setting Search Parameters.
Various conditions can be specified for restriction enzyme analysis using Takara Cut-Site Navigator.
The following 6 types of restriction enzyme analysis settings are available:
a) RangeParameters c) - f) are hidden. To display all parameters, please click "Setting Details".
b) Enzyme
c) Cutting Type
d) Search Methylation-Sensitive Enzymes
e) Recognition Sequence Length
f) Frequency
See below for details of the each setting.
- a) Range

This setting can be used to specify the nucleotide position range of the input sequence information that is used for the restriction enzyme search.
Input the range using the numerical value of the sequence position. - b) Enzyme
Limit the analysis to specific restriction enzymes using this setting. It may be used to determine whether one or more recognition sites exist for a specific enzyme(s).
Select the check box to the left of any restriction enzymes that you would like to include in the analysis.
To display restriction site information, hover the cursor over the name of a restriction enzyme.
The corresponding restriction enzyme recognition sequence will be displayed. This function is useful for checking the cut site of a particular enzyme.
Click on the name of a restriction enzyme to open the Takara Bio website product page for that restriction enzyme.
This is useful when checking detailed information for a restriction enzyme.
- c) Cutting Type
The type of restriction performed by each restriction enzyme can be selected as a search condition.
Select one or more cutting types:
blunt ends
sticky end (5'-) [5' end overhang]
sticky end (3'-) [3' end overhang]
Please note that the default settings includes all 3 types. - d) Methylation-Sensitive Enzymes
Some restriction enzymes are methylation-sensitive and are unable cut a recognition site if it is modified by methylation.
This setting can be used to limit an analysis to particular classes of methylation-sensitive restriction enzymes.
The following three types of methylation sensitivity can be selected as search conditions.
CpG methylase (5mCG): Restriction enzymes that are inhibited by methylation performed by CpG methylase (5mCG) (e.g., mammalian genomic DNA methylation analysis).
dam methylase (G6mATC): Restriction enzymes that are inhibited by methylation performed by dam methylase (G6mATC) (e.g., methylase from E. coli).
dcm methylase (C5mCWGG): Restriction enzymes that are affected by methylation performed by dcm methylase (G6mCWGG) (e.g., methylase from E. coli).
When each type is selected, the output data will include the corresponding methylation sensitivity information, as shown below.
When the analysis results are displayed using the "Sequence" view, methylation sensitive restriction enzymes will be indicated with an asterisk, as shown below.
When analysis results are displayed using the " Methylation-sensitive Enzymes List " view, only methylation sensitive restriction enzymes will be shown, as indicated below.
-
-
e) Recognition Sequence Length
The length of the restriction enzyme recognition sequence can be selected as a search parameter.
Three options can be selected using the drop-down menu: "4", "5" and "6".
4: Selects restriction enzymes that recognize 4 or more base pairs.
5: Selects restriction enzymes that recognize 5 or more base pairs.
6: Selects restriction enzymes that recognize 6 or more base pairs.
-
f) Frequency
The frequency with which a restriction enzyme cuts the query sequence can be selected as a search parameter.
Seven options can be selected using the drop-down menu: "Not Zero" and "0" through "5".
Not Zero : Use this setting to include only enzymes that cut at least once.
0 : Limits the analysis to restriction enzymes that do not cut the query sequence in any locations.
1 : Limits the analysis to restriction enzymes that cut the query sequence in 1 location.
2 : Limits the analysis to restriction enzymes that cut the query sequence in 2 location.
3 : Limits the analysis to restriction enzymes that cut the query sequence in 3 location.
4 : Limits the analysis to restriction enzymes that cut the query sequence in 4 location.
5 : Limits the analysis to restriction enzymes that cut the query sequence in 5 location.
- a) Range
- Once selection of the search parameters is complete, select the search display method using "OutPut".
Four display types can be selected: "Enzyme List", "Sequence", "Cutting Image" and "Methylation-sensitive Enzymes List".

Caution! If you had entered ambigious codes, the results might include ambiguous cut sites.
Please See below for the details of each display method.
* "Enzyme List"
The restriction enzymes that fulfill the search conditions are displayed in tabular form.
The results that are displayed in the list can be sorted by restriction enzyme name or by cut frequency.
Click the "Sort by Name" or "Sort by Frequency" button.
* "Sequence"
This view displays the query sequence information and the name of the restriction enzyme for each restriction site.
The position of the restriction site is displayed in parentheses to the right of the restriction enzyme name.
If you wish to display the amino acid sequence corresponding to the base sequence, do so by entering a check mark in "Frame 1" through "Frame 6," according to the frame desired.
Termination codons and ambiguous amino acids are described as "*".
Export a text file of the analysis results to your local hard drive using one of the export buttons as shown below.

"Export File (Only Single Stranded)": Only single strand sequence information in the designated range will be exported.
"Export File (ALL)": All information that is displayed on the screen (base sequence information, amino acid sequence information, restriction enzyme information) will be exported.
* "Cutting Image"
This output view displays a graphical illustration of restriction site positions on the query sequence.
By clicking the 2 positions on the graphic and clicking the "Submit" button, you can zoom in the clipped sequence.
If you want to return the default range setting, click "Range Clear" button to reset the sequence range and click "Submit" button.
Please note that the names of restriction enzymes may be shown overlapped when their cut locations overlap; this is not a malfunction.
After the zoom function has been executed, you can view the results.
(If you want to see it more clearly, change the display format into "Sequence" display so that enzyme names appear without overlapped.)
* "Methylation-sensitive Enzymes List"
When search parameters for "Methylation-sensitive Enzymes" are used, " Methylation-sensitive Enzymes List" will display only those restriction enzymes that meet the search conditions.
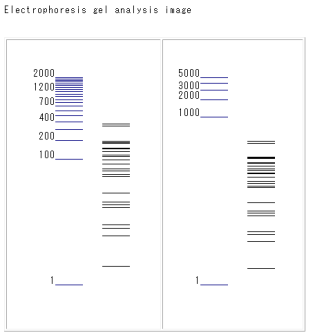
* "Go GelSimulation"
When the "Go GelSimulation" that is displayed on the right side in each display format is clicked, a simulated electrophoresis image will be produced.
The image corresponds to expected banding patterns that occur after restriction with the selected enzymes and analysis by gel electrophoresis to confirm restriction digestion.
The blue bands on the left indicate DNA markers.
* "All Clear"
If you want to return the default setting, click "All Clear" button to reset the all parameters and the inputted information.